28 posts tagged with "Programming"

View All Tags

Visual Studio Live 2019: San Diego

· 13 min read
Scottie Enriquez
Senior Solutions Developer at Amazon Web Services

Contents

Visual Studio Live in San Diego was an amazing opportunity to learn about new Microsoft technology like Azure's artificial intelligence offerings and .NET Core 3.0. I attended some talks about leadership and Agile as well. I've put together several proofs of concept and documented what I learned about:

  • Azure Cognitive Services
  • ASP.NET Core Health Checks and Startup.cs Inline Endpoints
  • .NET Core CLI Tooling for AWS Lambda
  • .NET Core 3.0 Linux Worker with systemd Integration
  • Windows Subsystem for Linux 2 and Windows Terminal
  • The Dynamics of a Healthy Team
  • Goodhart's Law and the Hawthorne Effect

Azure Cognitive Services

The keynote this year was AI for the Rest of Us and was delivered by Damian Brady. One of the core themes of the talk is that artificial intelligence and machine learning has become infinitely more accessible to programmers. Cloud providers have made their algorithms and statistical models available via easily consumable RESTful services. Much of the talk centered around a sample web application that consumed Azure's out-of-the-box computer vision and translation services to manage a company's inventory. One feature was identifying an item in a picture returned to a warehouse. Another was translating foreign customer reviews to English and analyzing their sentiment.

I decided to put together a couple of quick demos and was truly amazed with the results. In about 20 lines of Python 3 code and 10 minutes, I was able to read text from an image on a whiteboard. You can find a pipenv-enabled demo here.

main.py
subscription_key = os.environ['COMPUTER_VISION_SUBSCRIPTION_KEY']
endpoint = os.environ['COMPUTER_VISION_ENDPOINT']
computervision_client = ComputerVisionClient(endpoint, CognitiveServicesCredentials(subscription_key))
remote_image_printed_text_url = 'https://scottie-io.s3.amazonaws.com/vslive-whiteboard.jpg'
recognize_printed_results = computervision_client.batch_read_file(remote_image_printed_text_url, raw=True)
operation_location_remote = recognize_printed_results.headers["Operation-Location"]
operation_id = operation_location_remote.split("/")[-1]
while True:
get_printed_text_results = computervision_client.get_read_operation_result(operation_id)
if get_printed_text_results.status not in ['NotStarted', 'Running']:
break
time.sleep(1)
if get_printed_text_results.status == TextOperationStatusCodes.succeeded:
for text_result in get_printed_text_results.recognition_results:
for line in text_result.lines:
print(line.text)
print(line.bounding_box)

In about 10 lines of C# using .NET Core 3.0, I was able to detect the language and sentiment of generic text. You can find the full code here.

text-analytics/Program.cs
string textToAnalyze = "今年最強クラスの台風が週末3連休を直撃か...影響とその対策は?";
ApiKeyServiceClientCredentials credentials = new ApiKeyServiceClientCredentials(subscriptionKey);
TextAnalyticsClient client = new TextAnalyticsClient(credentials)
{
Endpoint = endpoint
};
OutputEncoding = System.Text.Encoding.UTF8;
LanguageResult languageResult = client.DetectLanguage(textToAnalyze);
Console.WriteLine($"Language: {languageResult.DetectedLanguages[0].Name}");
SentimentResult sentimentResult = client.Sentiment(textToAnalyze, languageResult.DetectedLanguages[0].Iso6391Name);
Console.WriteLine($"Sentiment Score: {sentimentResult.Score:0.00}");

These are features that I would have previously told clients were completely out of the question given the complex mathematics and large data set required to train the models. Developers can now reap the benefits of machine learning with virtually no knowledge of statistics.

ASP.NET Core Health Checks and Inline Endpoints

.NET Core now supports built-in service health checks that can be easily configured in Startup.cs with a couple of lines of code.

public class Startup
{
public void ConfigureServices(IServiceCollection services)
{
services.AddHealthChecks();
}

public void Configure(IApplicationBuilder app)
{
app.UseRouting();
app.UseEndpoints(endpoints =>
{
endpoints.MapHealthChecks("/health");
});
}
}

This creates a /health endpoint that returns an HTTP status code and brief message indicating whether or not the API is available and can process requests. This is ideal for integrating with load balancers, container orchestrators, and reports. If the default checks don't suffice for your needs, you can also create custom health check by implementing the IHealthCheck interface and registering it. Be aware that health checks are intended to be able to run quickly, so if the custom health check has to open connections with other systems or perform lengthy I/O, the polling cycle needs to account for that.

public class MyHealthCheck : IHealthCheck
{
public Task CheckHealthAsync(
HealthCheckContext context,
CancellationToken cancellationToken = default(CancellationToken))
{
return Task.FromResult(HealthCheckResult.Healthy("A healthy result."));
}
}

You can also create simple HTTP endpoints inline in Startup.cs without creating an API controller class in addition to registering API controllers normally.

app.UseEndpoints(endpoints =>
{
endpoints.MapControllers();
endpoints.Map("/startup", context =>
{
return context.Response.WriteAsync("This is from Startup.cs");
});
endpoints.MapHealthChecks("/health");
});

Find the complete source code here.

.NET Core CLI Tooling for AWS Lambda

AWS has built extensive CLI tooling and templating for building .NET Core serverless functions on Lambda. Assuming you have .NET Core installed and added to your PATH, you can run dotnet new -i Amazon.Lambda.Templates to install the Lambda templates and dotnet tool install -g Amazon.Lambda.Tools to install the Lambda tools. With a few commands, you can have a brand new .NET Core serverless function created, deployed to AWS, and invoke the function from the command line.

#!/usr/env/bin bash
# create a new serverless function from the Lambda template
dotnet new lambda.EmptyFunction --name MyFunction
# validate that the skeleton builds and initial unit tests pass
dotnet test MyFunction/test/MyFunction.Tests/MyFunction.Tests.csproj
# navigate to the project directory
cd MyFunction/src/MyFunction
# deploy function to AWS
dotnet lambda deploy-function MyFunction --function-role role
# validate that the Lambda function was properly created
dotnet lambda invoke-function MyFunction --payload "Hello, world!"

.NET Core 3.0 Linux Worker with systemd Integration

When I first wrote my first line of C# code back in 2012 as a young intern, .NET Core didn’t exist yet. At the time, .NET hadn't been open-sourced yet either. While powerful, .NET Framework was monolithic and only ran on Windows natively. Throughout college, I used Ubuntu and macOS and hadn't touched a Windows machine in years except for gaming. As a student, I fell in love with shells and preferred CLIs over cumbersome IDEs. While I remained a Unix enthusiast at home (macOS, Debian, and Manjaro), I felt that there was such a clear divide between this enterprise tool and the up-and-coming juggernaut in Node.js that was beginning to eat the server-side market share in an explosion of microscopic NPM packages.

Though I grew to love the crisp C# syntax and bundles of functionality in .NET Framework, .NET Core made me fall in love again. The first time that I wrote dotnet build and dotnet run on macOS was such a strange feeling. Even though Mono brought the CLR to Linux many years ago, being able to compile and run C# code on the .NET runtime out of the box was so satisfying. Sometimes, it still blows me away that I have a fully fledged .NET IDE in JetBrains' Rider running on my Debian box. All this to say, Microsoft's commitment to Linux makes me excited for the future.

At Visual Studio Live this year, one of the new features discussed is systemd integration on Linux, which is analogous to writing Windows Services. The thought of writing a systemd service using .NET Core 3.0 (which was just released a few days ago) was pretty exciting, so I put together a fully functional example project to capture and log internet download speeds every minute.

I started by using the worker service template included in both Visual Studio and Rider. Configuring for systemd only requires one chained call: .UseSystemd(). It's worth noting that this still allows you to build and run using the CLI (i.e. dotnet run) without being integrated with systemd.

src/SpeedTestWorkerService/SpeedTestWorkerService/Program.cs
public static IHostBuilder CreateHostBuilder(string[] args) =>
Host.CreateDefaultBuilder(args)
.UseSystemd()
.ConfigureServices((hostContext, services) => { services.AddHostedService(); });

The Worker executes the given task until a cancellation token is received. I made a few modifications to the starter template such as changing the Task.Delay() millisecond parameter and implementing the speed test logic. Note that _logger is the dependency injected logging service.

src/SpeedTestWorkerService/SpeedTestWorkerService/Worker.cs
protected override async Task ExecuteAsync(CancellationToken stoppingToken)
{
while (!stoppingToken.IsCancellationRequested)
{
SpeedTestClient speedTestClient = new SpeedTestClient();
Settings settings = speedTestClient.GetSettings();
Server bestServer = settings.Servers[0];
_logger.LogInformation("Server name: " + bestServer.Name);
double downloadSpeed = speedTestClient.TestDownloadSpeed(bestServer);
_logger.LogInformation("Download speed (kbps): " + downloadSpeed);
await Task.Delay(60000, stoppingToken);
}
}

I also implemented a simple deployment script to migrate the .service file to the correct folder for systemd, map the executable, and start the service. The rest is handled by .NET Core.

#!/usr/env/bin bash
dotnet build
dotnet publish -c Release -r linux-x64 --self-contained true
sudo cp speedtest.service /etc/systemd/system/speedtest.service
sudo systemctl daemon-reload
sudo systemctl start speedtest.service

Windows Subsystem for Linux 2 and Windows Terminal

Though many of the talks at Visual Studio Live utilized Linux environments in Azure and AWS, none of the presenters developed in Linux during their demos. Instead they used WSL2 with Windows Terminal. In the latest Insiders build of Windows 10 (build 18917 or higher), Microsoft has shipped a Linux kernel too. This kernel has been specifically tuned for WSL2 and the performance is extremely solid. You can now also install various distros (i.e. Debian, Ubuntu) from the Microsoft Store and interact with them via a CLI.

You can also combine this with a preview of the new Windows Terminal. Which allows you to have multiple tabs running command lines for various environments simultaneously (i.e. PowerShell, Linux, etc.). You can even modify files on your Linux file system with Visual Studio code via a nifty plugin.
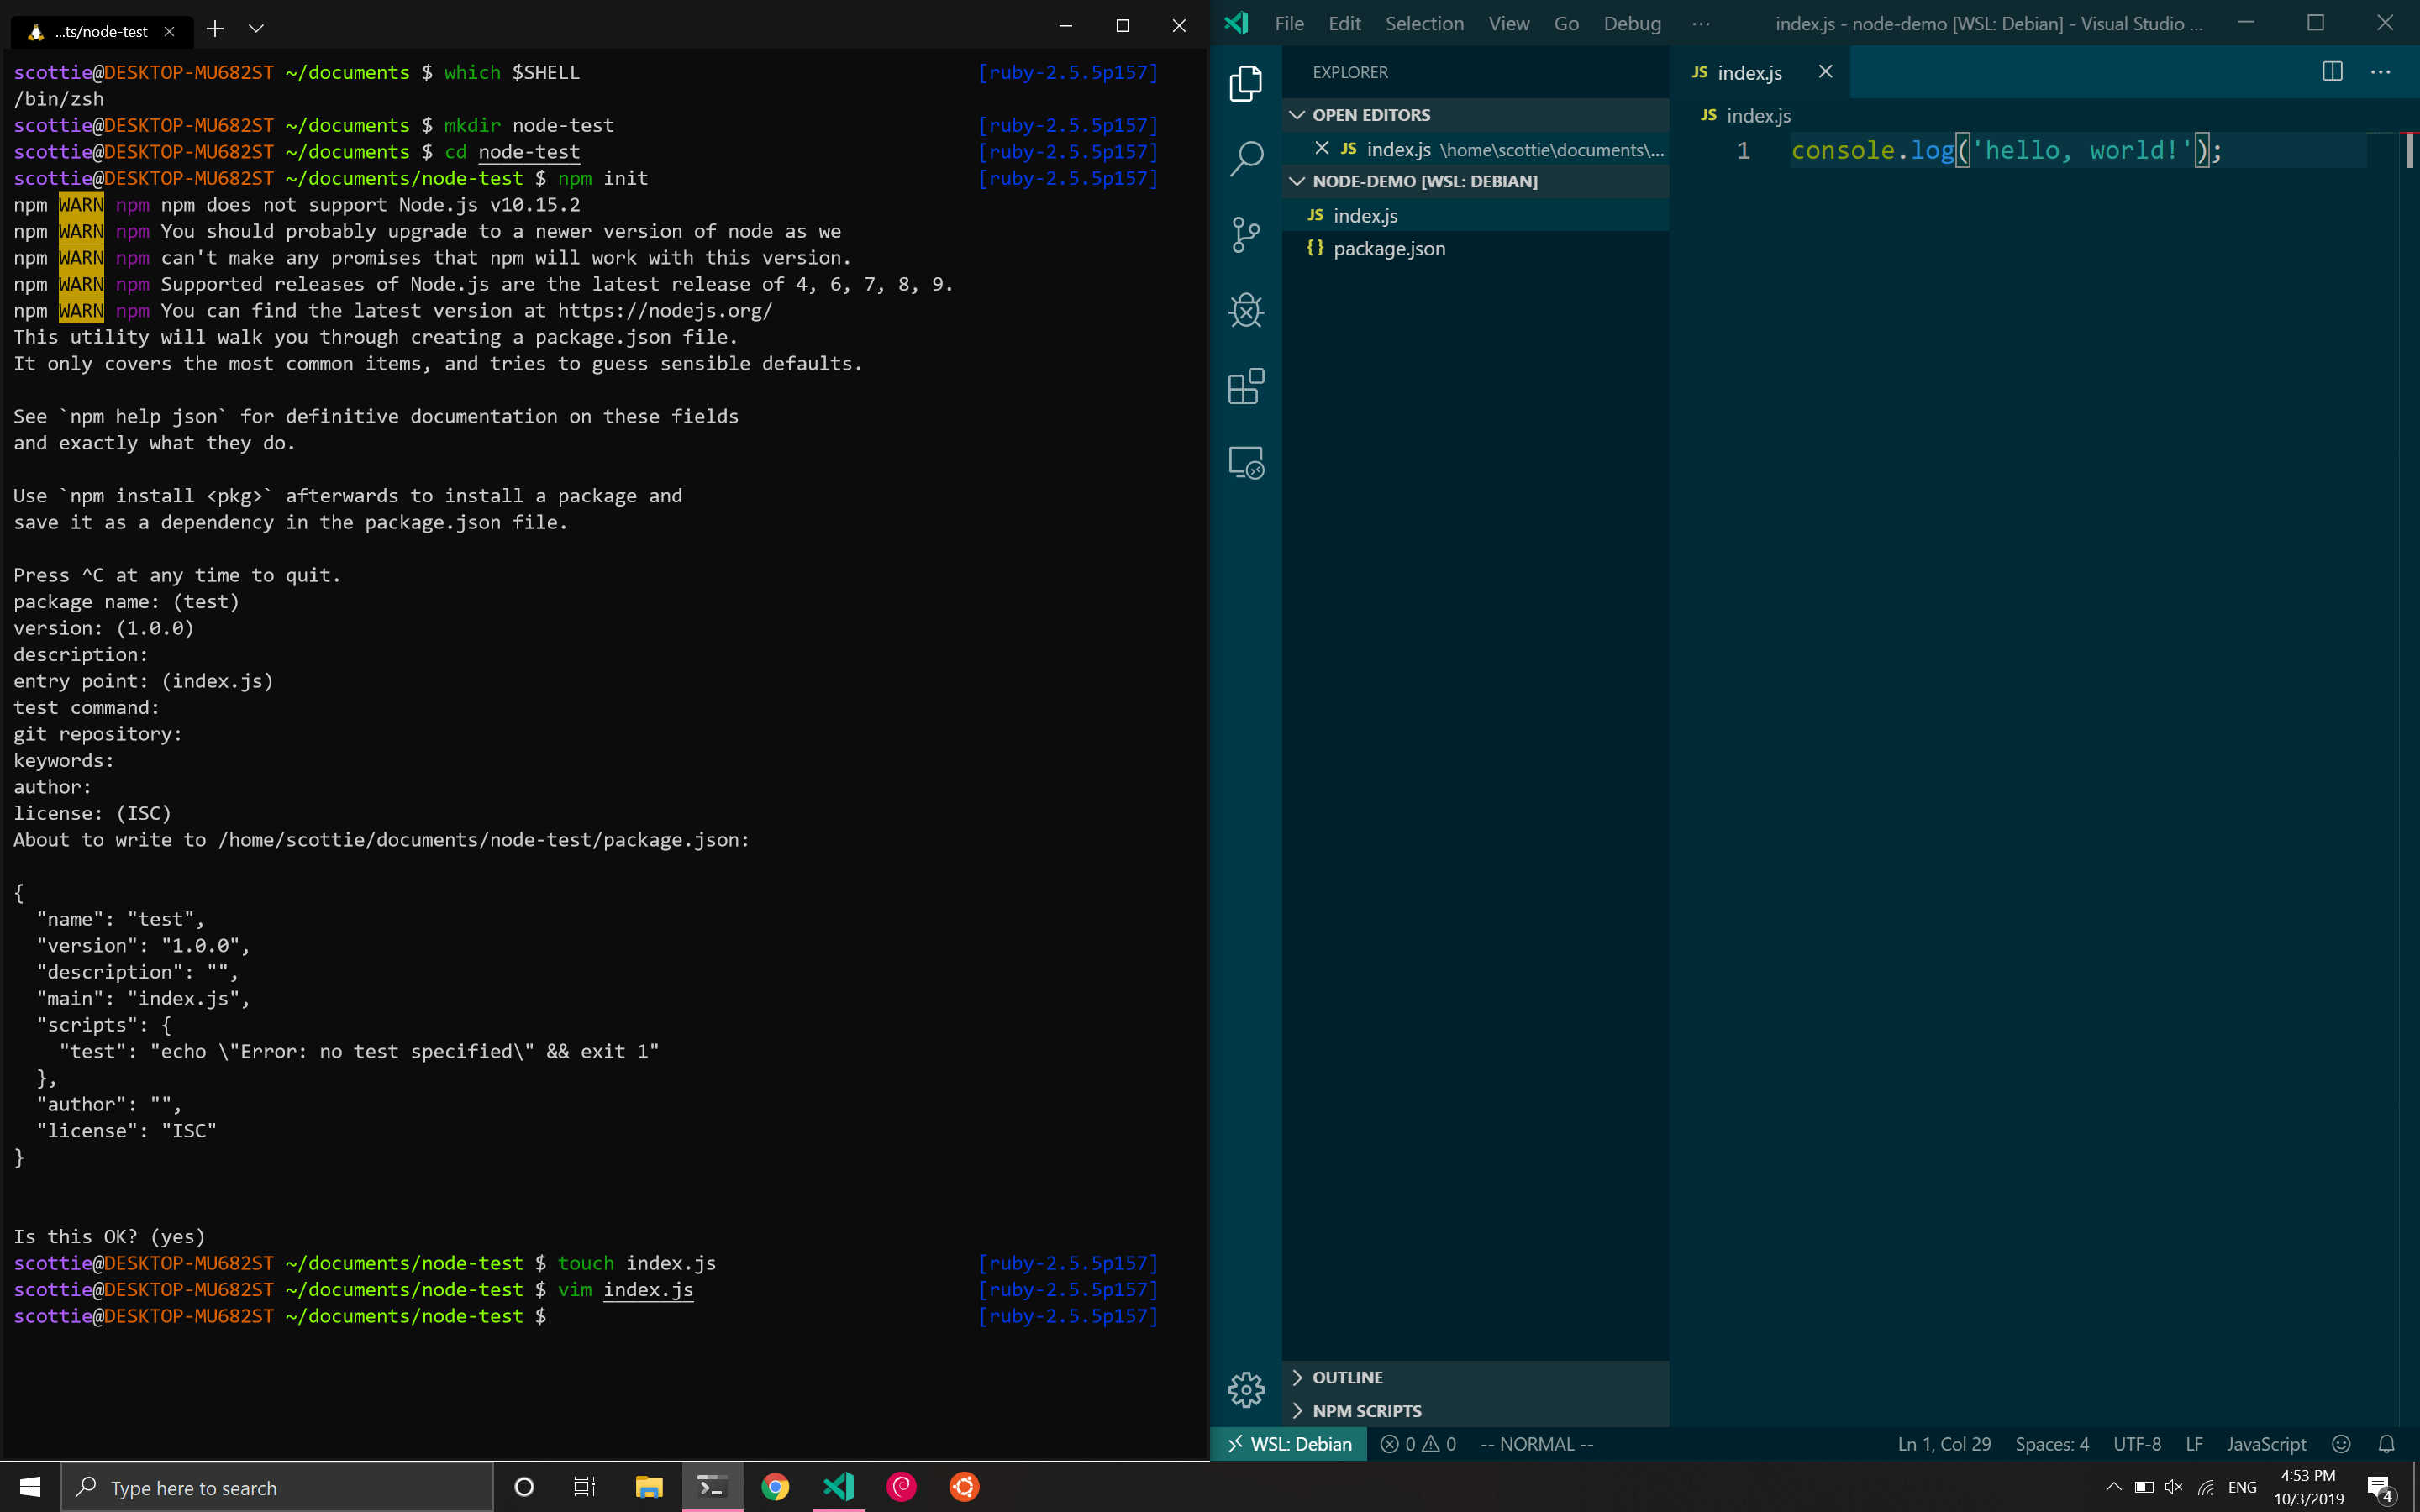
WSL

I installed Debian 10 plus my usual Linux tools like Vim and Zsh and found that the performance and usability were solid. I even went as far as to install and use some tools that aren't easy to use on Windows like Docker. I was able to run containers without any performance issues. Though all of these features and tools are still in preview, it shows Microsoft's commitment to Linux going forward. It also makes software development on Windows a lot more appealing in my opinion given that the majority of cloud infrastructure runs Linux.

The Dynamics of a Healthy Team

Though there were numerous exciting technical sessions throughout the week, some of my most valuable takeaways from the conference came from Angela Dugan's talks about leadership and metrics. Many of her points echoed much of the reading that I've done since transitioning to leadership about a year ago.

The first takeaway is that as leaders we need to find ways to create more continuous collaboration. According to quantitative surveys and informal discussion, one common complaint is that my team's developers often work alone on projects. While they often collaborate with business analysts and solution integrators outside of our team, it's quite common for us to only have the bandwidth to assign one software developer given their supply and demand. A recurring theme from the conference talks and Certified Scrum Master training is that cohesion and chemistry comes from the same team working on different projects.

One way to help achieve this goal is to decrease the number of simultaneous projects (i.e. works-in-progress) assigned to a developer. Admittedly, this is an area that I've fallen short in as a leader. In terms of resource planning, trying to make ends meet feels like a game of Tetris. It's difficult to prevent and manage an extensive buildup of backlog items, but managing client relations and expectations is even harder. For the sake of business satisfaction, we'll often compromise by dividing a developer's time between multiple efforts so that the clients feel that they're getting a timely response time. However, the taxes of context switching negate the benefits of being able to focus on one project at a time. Fundamentally, this is analogous to the divide and conquer principle in computer science. Even the smartest humans are bad at multitasking.

The final takeaway I had was that it's not enough to merely identify cultural and personality differences. My team has taken multiple personality tests to understand how we all view the world differently. As a company, we've hosted numerous multicultural events to understand how culture impacts our work (see Outliers by Malcolm Gladwell). However, I feel that my team doesn't necessarily work any differently despite these efforts yet.

Goodhart's Law and the Hawthorne Effect

During a fantastic talk on the dangers and benefits of collecting metrics, Angela introduced these two concepts that eloquently summed up some of the challenges my team has with identifying and reporting on quality metrics: Goodhart's Law and the Hawthorne Effect.

Goodhart's Law states that "when a measure becomes a target, it ceases to be a good measure." During the presentation, my mind immediately wandered to the arbitrary metric of time. Like many other giant corporations, my company has countless avenues of tracking time. I had a simple hypothesis that I was able to quickly validate by pulling up my timesheets: my hours always add up to 40 hours per week. If I have a doctor's appointment in the morning, I don't always stay late to offset it. On days that I have an 8pm CST call with Australia, I don't always get to leave the office early to get that time back. My boss certainly doesn't care, and I certainly wouldn't sweat a developer on my team for not working exactly 40 hours per week.

So why has time become the key target? Hypothetically, if I only worked 20 hours in a given week, nothing is stopping me from marking 40 hours. No one in their right mind is going to enter less than that. I'd also argue that some people wouldn't feel empowered to enter more than that. In reality, numerous other metrics would reflect my poor performance. All this makes me realize that any metric that's self-reported with arbitrary targets and a negative perception of its intentions is going to lead to false information and highly defensive data entry.

The next logical progression is considering a burndown chart. The x-axis represents time, and the y-axis often represents remaining effort in a two-week sprint. In a utopian world, the line of best fit would be a linear function with a negative slope. The reality is that project or portfolio managers call me when the burndown rate isn't fast enough for their liking. But again, why is the focus here time? Why aren't the most important metrics features delivered and customer satisfaction? Why not a burnup chart?

The Hawthorne Effect refers to the performance improvement that occurs when increased attention is paid to an employee's work. For a simple thought experiment, imagine that your job is to manually copy data from one system to another. Naturally, your throughput would be substantially improved if you got frequent feedback on how much data you were copying. It would probably also increase if your boss sat right behind you all day.

In leadership, we constantly observe our employees' work though I would argue it's rarely in the most productive contexts. Instead of measuring developers purely based on how many features they deliver, we almost always relate them to the estimates they're forced to give based on minimal and sometimes incorrect requirements as well as arbitrary and often unrealistic dates set by both ourselves and our customers. I can think of several metrics I track to report on project and operation health, but none that reflect a developer's happiness or psychological safety.

As a leader, I've fallen short in shielding developers from this. Consider the difference between "can you have this feature done by the end of the year?" and "how long will it take to deliver this feature?" The answer should ultimately be static between the two scenarios, but in the former question, I'm shifting the responsibility to deliver onto the developer. The developer feels immense pressure to conform their estimate to the context they've been placed in. As a leader, the responsibility should fall solely on me though. If the developer can't deliver the feature by the end of the year, it's up to me to acquire another resource or set more realistic expectations with the client.

SonarCloud for C# Projects with Travis CI

· 3 min read
Scottie Enriquez
Senior Solutions Developer at Amazon Web Services

Example SonarCloud/SonarScanner C# Integration for Travis CI

SonarQube is a very powerful source code continuous inspection tool. It's incredibly valuable to have integrated into a project's CI/CD pipeline to help maintain code quality and prevent issues. In the process of adding this to some existing open-source C# projects, I discovered that there's not quality, up-to-date documentation on integrating C# inspection with Travis CI. This GitHub project serves as a functioning example.

Getting Started

Note that you'll need a SonarCloud account created, a project set up, and a token for the project.

Travis CI Setup

You can either use an existing GitHub repository or create a new one. You'll need to enable Travis CI for the repository and create a secure environment variable named SONAR_TOKEN initialized as your SonarCloud token. Make sure that you don't commit the token in your source code or expose it via logs.

Which Release of This Project to Use

You'll notice that there are three releases of this example project. The first two require Mono as a dependency because they utilize .NET Framework builds of the SonarScanner for MSBuild tool. The third option only uses .NET Core. It's worth noting that the Travis CI builds with Mono and .NET Core take on average ten minutes to complete whereas the .NET Core only builds take roughly two minutes.

0.0.1: SonarScanner for MSBuild 4.0.2.892

  • .NET Core: 2.1.502
  • Mono: latest
  • Notes: This version uses an old version of SonarScanner. This release is not recommended for any use.

0.0.2: SonarScanner for MSBuild version 4.6.1.2049 (.NET Framework 4.6)

  • .NET Core: 2.1.502
  • Mono: latest
  • Notes: This version only uses .NET Core because my unit tests in the sample class library target it. If your project only uses .NET Framework, you can drop the .NET Core dependency from the Travis CI YAML file. This release is recommended for C# projects targeting .NET Framework.

1.0.0: SonarScanner for MSBuild version 4.6.1.2049 (.NET Core)

  • .NET Core: 2.1.502
  • Mono: none
  • Notes: This version assumes no targets of .NET Framework and does not install Mono. This version is recommended for pure .NET Core projects. It's also the most performant.

Updating Your Project

Updating the Travis CI YAML File

Start by including the SonarCloud addon and pasting in your SonarCloud organization name.

.travis.yml
addons:
sonarcloud:
organization: "YOUR_ORG_NAME_HERE"

You'll also need to run the /tools/travis-ci-install-sonar.sh script as part of before-install section and /tools/travis-ci-build.sh as part of the script section.

Modifying Build Script

You'll need to make a few replacements in this file. Add your organization name and project key to the SonarScanner.MSBuild.dll (or SonarScanner.MSBuild.exe for the .NET Framework version) arguments. Note that you can also expose these as environment variables like SONAR_TOKEN. You'll also want to add any project-specific build and test commands to this script.

tools/travis-ci-build.sh
dotnet ../tools/sonar/SonarScanner.MSBuild.dll begin /o:"YOUR_ORG_NAME_HERE" /k:"YOUR_PROJECT_KEY_HERE" /d:sonar.host.url="https://sonarcloud.io" /d:sonar.verbose=true /d:sonar.login=${SONAR_TOKEN}
# Add additional build and test commands here
dotnet build
dotnet test
dotnet ../tools/sonar/SonarScanner.MSBuild.dll end /d:sonar.login=${SONAR_TOKEN}

Testing

Your Travis CI build will fail if there are any issues with the SonarScanner command. If the build passes, you can view the feedback via the SonarCloud dashboard.

References

I was able to find a project called NGenerics that utilizes an older version of SonarScanner with some syntax differences. There was also a short blog post by Riaan Hanekom that expands on it. These were extremely helpful starting points.

Travis CI Build Status

Build Status

Testing .NET Standard Libraries Using .NET Core, NUnit, and Travis CI

· 6 min read
Scottie Enriquez
Senior Solutions Developer at Amazon Web Services

While my development choices for the frontend change as rapidly as new JavaScript frameworks come and go, I've remained pretty consistent with using the .NET ecosystem for my server-side needs. I still use Node.js, Spring Boot, and Flask for several side projects, but I've grown to love the power of .NET and C# over the past several years while it has been the default technology at my job. My two biggest complaints were the monolithic scale of .NET Framework and the fact that it required Windows (or Mono which hasn't always been backed by Xamarin/Microsoft). Both of these changed with the advent of .NET Core. This alternative is cross-platform, modular, and much more performant. While both .NET Framework and .NET Core are implementations of .NET Standard, .NET Core very much seems to be the preferred way of the future.

Like many other .NET developers, I've packaged logic into open-source libraries and published to NuGet for easy distribution. However, also like many other developers, I've written packages to target .NET Framework. This is a problem because these packages can only be used with .NET Framework. The alternative is to target .NET Standard instead. As described by Microsoft docs, .NET Standard is a set of APIs that all .NET implementations must provide to conform to the standard. Because of this, having your NuGet packages target .NET Standard means that your package has support for .NET Framework, .NET Core, Mono, Xamarin, etc.

The primary reason that Microsoft recommends sticking with .NET Framework over .NET Core is compatibility. Essentially, they want developers to choose .NET Core first and .NET Framework second if there is some dependency that's not .NET Standard compatible. This shift in mentality means that libraries need to target .NET Standard by default. In order for a library to target .NET Standard, all dependent libraries must target .NET Standard as well which is arguably the biggest hurdle that .NET Core adoption is facing at this time.

With such a radical shift in the ecosystem comes some growing pains and a great deal of learning. While working to convert one of my libraries to .NET Standard, I faced challenges with setting up my testing infrastructure, so I wanted to share what I learned. This post will walk you through setting up a .NET Standard library, unit tests, and continuous integration using Travis CI. A working example with complete source code and Travis CI configured can be found on GitHub.

Preparing Your Development Environment

The demo source code included in this post targets .NET Standard 2.0. If you are running an older version of Visual Studio, you will either need to upgrade or install the SDKs manually. Visual Studio 2017 version 15.3 and on for Windows include the requisite SDK. For macOS, the Visual Studio IDE can be used as well. This demo was developed using 7.5 Preview 1. For Linux, .NET Core can be installed via scripts and an alternative editor like Visual Studio Code or Rider from JetBrains can be used for development.

Creating the Domain Project

This library does simple addition for type decimal. We'll start by creating a project for the domain logic. Be sure to create a .NET Standard library and not a .NET Framework library. Next, add an AdditionService class with function to execute the logic.

src/Gg.Scottie.Dotnet.Standard.Testing.Demo.Domain/AdditionService.cs
public class AdditionService : IAdditionService
{
public decimal Add(decimal first, decimal second)
{
return first + second;
}
}

Creating the Test Project

This repo uses NUnit for unit testing. The NUnit project offers templates for creating test projects, but this post walks through adding each dependency manually to clarify some of the nuances. As noted in the NUnit wiki, Microsoft has specified that tests must target a specific platform in order to properly validate the expected behavior of the .NET Standard-targeted code against that platform. While this may seem counterintuitive to the nature of .NET Standard, keep in mind that you can write multiple tests to support multiple platforms. For the sake of this demo, just target .NET Core. Instead of creating a .NET Standard project for the unit tests create a .NET Core class library.

The first dependency is Microsoft.NET.Test.Sdk. As noted previously, .NET Core is much more modular. This package is Microsoft's testing module. The next two dependencies are NUnit and NUnit3TestAdapter. These two packages will allow us to write NUnit tests and run them via the command line. We can now create our first unit test.

src/Gg.Scottie.Dotnet.Standard.Testing.Unit.Tests/AdditionServiceTests.cs
[TestFixture]
public class AdditionServiceTests
{
[Test]
public void Should_Add_ForStandardInput()
{
//arrange
decimal first = 1.0m;
decimal second = 2.0m;
decimal expectedOutput = 3.0em;
IAdditionService additionService = new AdditionService();

//act
decimal actualSum = additionService.Add(first, second);

//assert
actualSum.Should().Be(expectedSum);
}
}

You can run the unit tests locally using an IDE like Visual Studio or Rider or via terminal with the command dotnet test. Note that you can also supply a path to your .csproj file to only test specific projects in your solution.

Configuring Travis CI for GitHub Projects

If you plan on hosting your source code in a public repository on GitHub, you can leverage a testing automation tool called Travis CI for free. To get started, log into the Travis CI site with GitHub authentication and enable your repository for testing through the web interface. After that, simply add a YAML file in the root of your project named .travis.yml.

.travis.yml
language: csharp
mono: none
dotnet: 2.0.0

install:
- dotnet restore src

script:
- dotnet build src
- dotnet test src/Gg.Scottie.Dotnet.Standard.Testing.Unit.Tests/Gg.Scottie.Dotnet.Standard.Testing.Unit.Tests.csproj

Testing Multiple Targets on Windows and *NIX

As mentioned above, the primary benefit of targeting .NET Standard is that it can be added as a dependency by newer versions of .NET Framework and .NET Core without any additional code or configuration. With that being said, you may want to have unit tests that target both .NET Core and .NET Framework to ensure that your library behaves as expected with each. We can add multiple targets to our testing project by simply modifying the .csproj. By changing the TargetFramework tag to TargetFrameworks and changing the value to netcoreapp2.0;net47 we can test against both .NET Core 2.0 and .NET Framework 4.7. As you might imagine, this could cause issues for non-Windows developers because there is no native *NIX support for .NET Framework. In the XML, we can even add conditions to only target .NET Core if the tests are not running on Windows by adding Condition="'$(OS)' != 'Windows_NT'">netcoreapp2.0.

Colley Matrix NuGet Package

· 3 min read
Scottie Enriquez
Senior Solutions Developer at Amazon Web Services

Overview

It's very well documented that I'm a huge college football fan. We're presently in the College Football Playoff era of Division I football, which involves a selection committee choosing four playoff teams to compete to be the national champion. The previous era, known as the Bowl Championship Series era, involved a combined poll of human experts and computer algorithms choosing the two best teams to play in the national championship game. One such algorithm is known as the Colley Matrix. Though not a factor in the post-season selection process anymore, it's still referred to at times, particularly when debating the selection committee’s decisions. Based on the whitepaper written by Colley himself and [an existing JavaScript implementation](an existing JavaScript implementation), I developed this NuGet package for simulating head-to-head matchups and applying the Colley algorithm. This algorithm can be applied to any sport or competitions without tie games.

Usage

The ColleyMatrix client exposes two methods: SimulateGame and Solve. The client constructor takes one argument: numberOfTeams.

ColleyMatrix colleyMatrix = new ColleyMatrix(numberOfTeams);

This will create a client with an underlying sparse matrix where the dimensions span from 0 to numberOfTeams - 1 corresponding to each team's ID. Next, we can simulate matchups.

colleyMatrix.SimulateGame(winnerId, loserId);

Note that if the winnerId or loserId is not valid respective to the sparse matrix's dimensions, an exception will be thrown.

You can solve the sparse matrix at any point without modifying the internal state. The solved vector that is returned is a list of scores with the highest score indicating the best team.

IEnumerable<double> solvedVector = colleyMatrix.Solve();

Basics of Implementation

SimulateGame updates the matrix state which is wrapped by an interface called IMatrixProvider. This removes the dependency on a specific matrix implementation from the underlying domain logic. For reference, the ColleyMatrix client ultimately injects a Math.NET SparseMatrix. The updates to the matrix state are very simple.

src/ColleyMatrix/Service/ColleyMatrixService.cs
double gameCount = _matrixProvider.GetValue(winnerId, loserId);
_matrixProvider.SetValue(winnerId, loserId, gameCount - 1);
_matrixProvider.SetValue(loserId, winnerId, gameCount - 1);
_matrixProvider.SetValue(winnerId, winnerId, _matrixProvider.GetValue(winnerId, winnerId) + 1);
_matrixProvider.SetValue(loserId, loserId, _matrixProvider.GetValue(loserId, loserId) + 1);

A list of teams and their corresponding ratings are also maintained.

src/ColleyMatrix/Service/ColleyMatrixService.cs
_teams[winnerId].Wins++;
_teams[loserId].Losses++;
_teams[winnerId].ColleyRating = ComputeColleyRating(_teams[winnerId].Wins, _teams[winnerId].Losses);
_teams[loserId].ColleyRating = ComputeColleyRating(_teams[loserId].Wins, _teams[loserId].Losses);

The formula for computing the Colley rating is very simple.

src/ColleyMatrix/Service/ColleyMatrixService.cs
1 + (wins - losses) / 2;

For the Solve method, the matrix is lower-upper factorized then solved for the vector of the teams' Colley ratings.

src/ColleyMatrix/Service/ColleyMatrixService.cs
IEnumerable<double> colleyRatings = _teams.Select(team => team.ColleyRating);
IEnumerable<double> solvedVector = _matrixProvider.LowerUpperFactorizeAndSolve(colleyRatings);

Build Status

Build status

Kanji Alive NuGet Package

· 2 min read
Scottie Enriquez
Senior Solutions Developer at Amazon Web Services

Overview

This NuGet package provides a C# interface to easily query and fetch kanji data from the Kanji Alive public API. This package is designed to simplify development of Japanese learning desktop and web applications on the C#/.NET platform.

Usage

All of the API endpoints are accessible using the KanjiAliveClient. To use the client, simply instantiate while passing your Mashape API key as the sole constructor parameter. You can obtain an API key here.

KanjiAliveClient client = new KanjiAliveClient("MY_API_KEY");

Nested inside of the main client are three subclients that mirror the structure of the API endpoints: AdvancedSearchClient, BasicSearchClient, and KanjiDetailsClient. The endpoints are exposed as asynchronous instance methods, so be sure to await them.

<List<KanjiSimpleResponse>> apiResponse = await client.AdvancedSearchClient.SearchByKanjiStrokeNumber(5);

Contributing

In order to obfuscate your API key for integration tests, add your API key to the Windows Registry as a string value with the key set to MASHAPE_API_KEY. This allows you to discreetly fetch your key at runtime instead of exposing it in the source code.

KanjiAliveClient client = new KanjiAliveClient(Environment.GetEnvironmentVariable("MASHAPE_API_KEY"));

Please ensure that any code additions follow the styling laid out in the .DotSettings file and that all unit and integration tests pass before submitting a pull request. For break fixes, please add tests. For any questions, issues, or enhancements, please use the issue tracker for this repository.

Build Status

Build status

Thanks

Special thanks to the Kanji Alive team for not only providing their kanji data in a clean, consumable format, but also for hosting a RESTful API to expose it too. Note that if you would like to include this kanji data locally in your project, you can download the language data and media directly from this repo.

Burnt Orange Atom Themes

· 2 min read
Scottie Enriquez
Senior Solutions Developer at Amazon Web Services

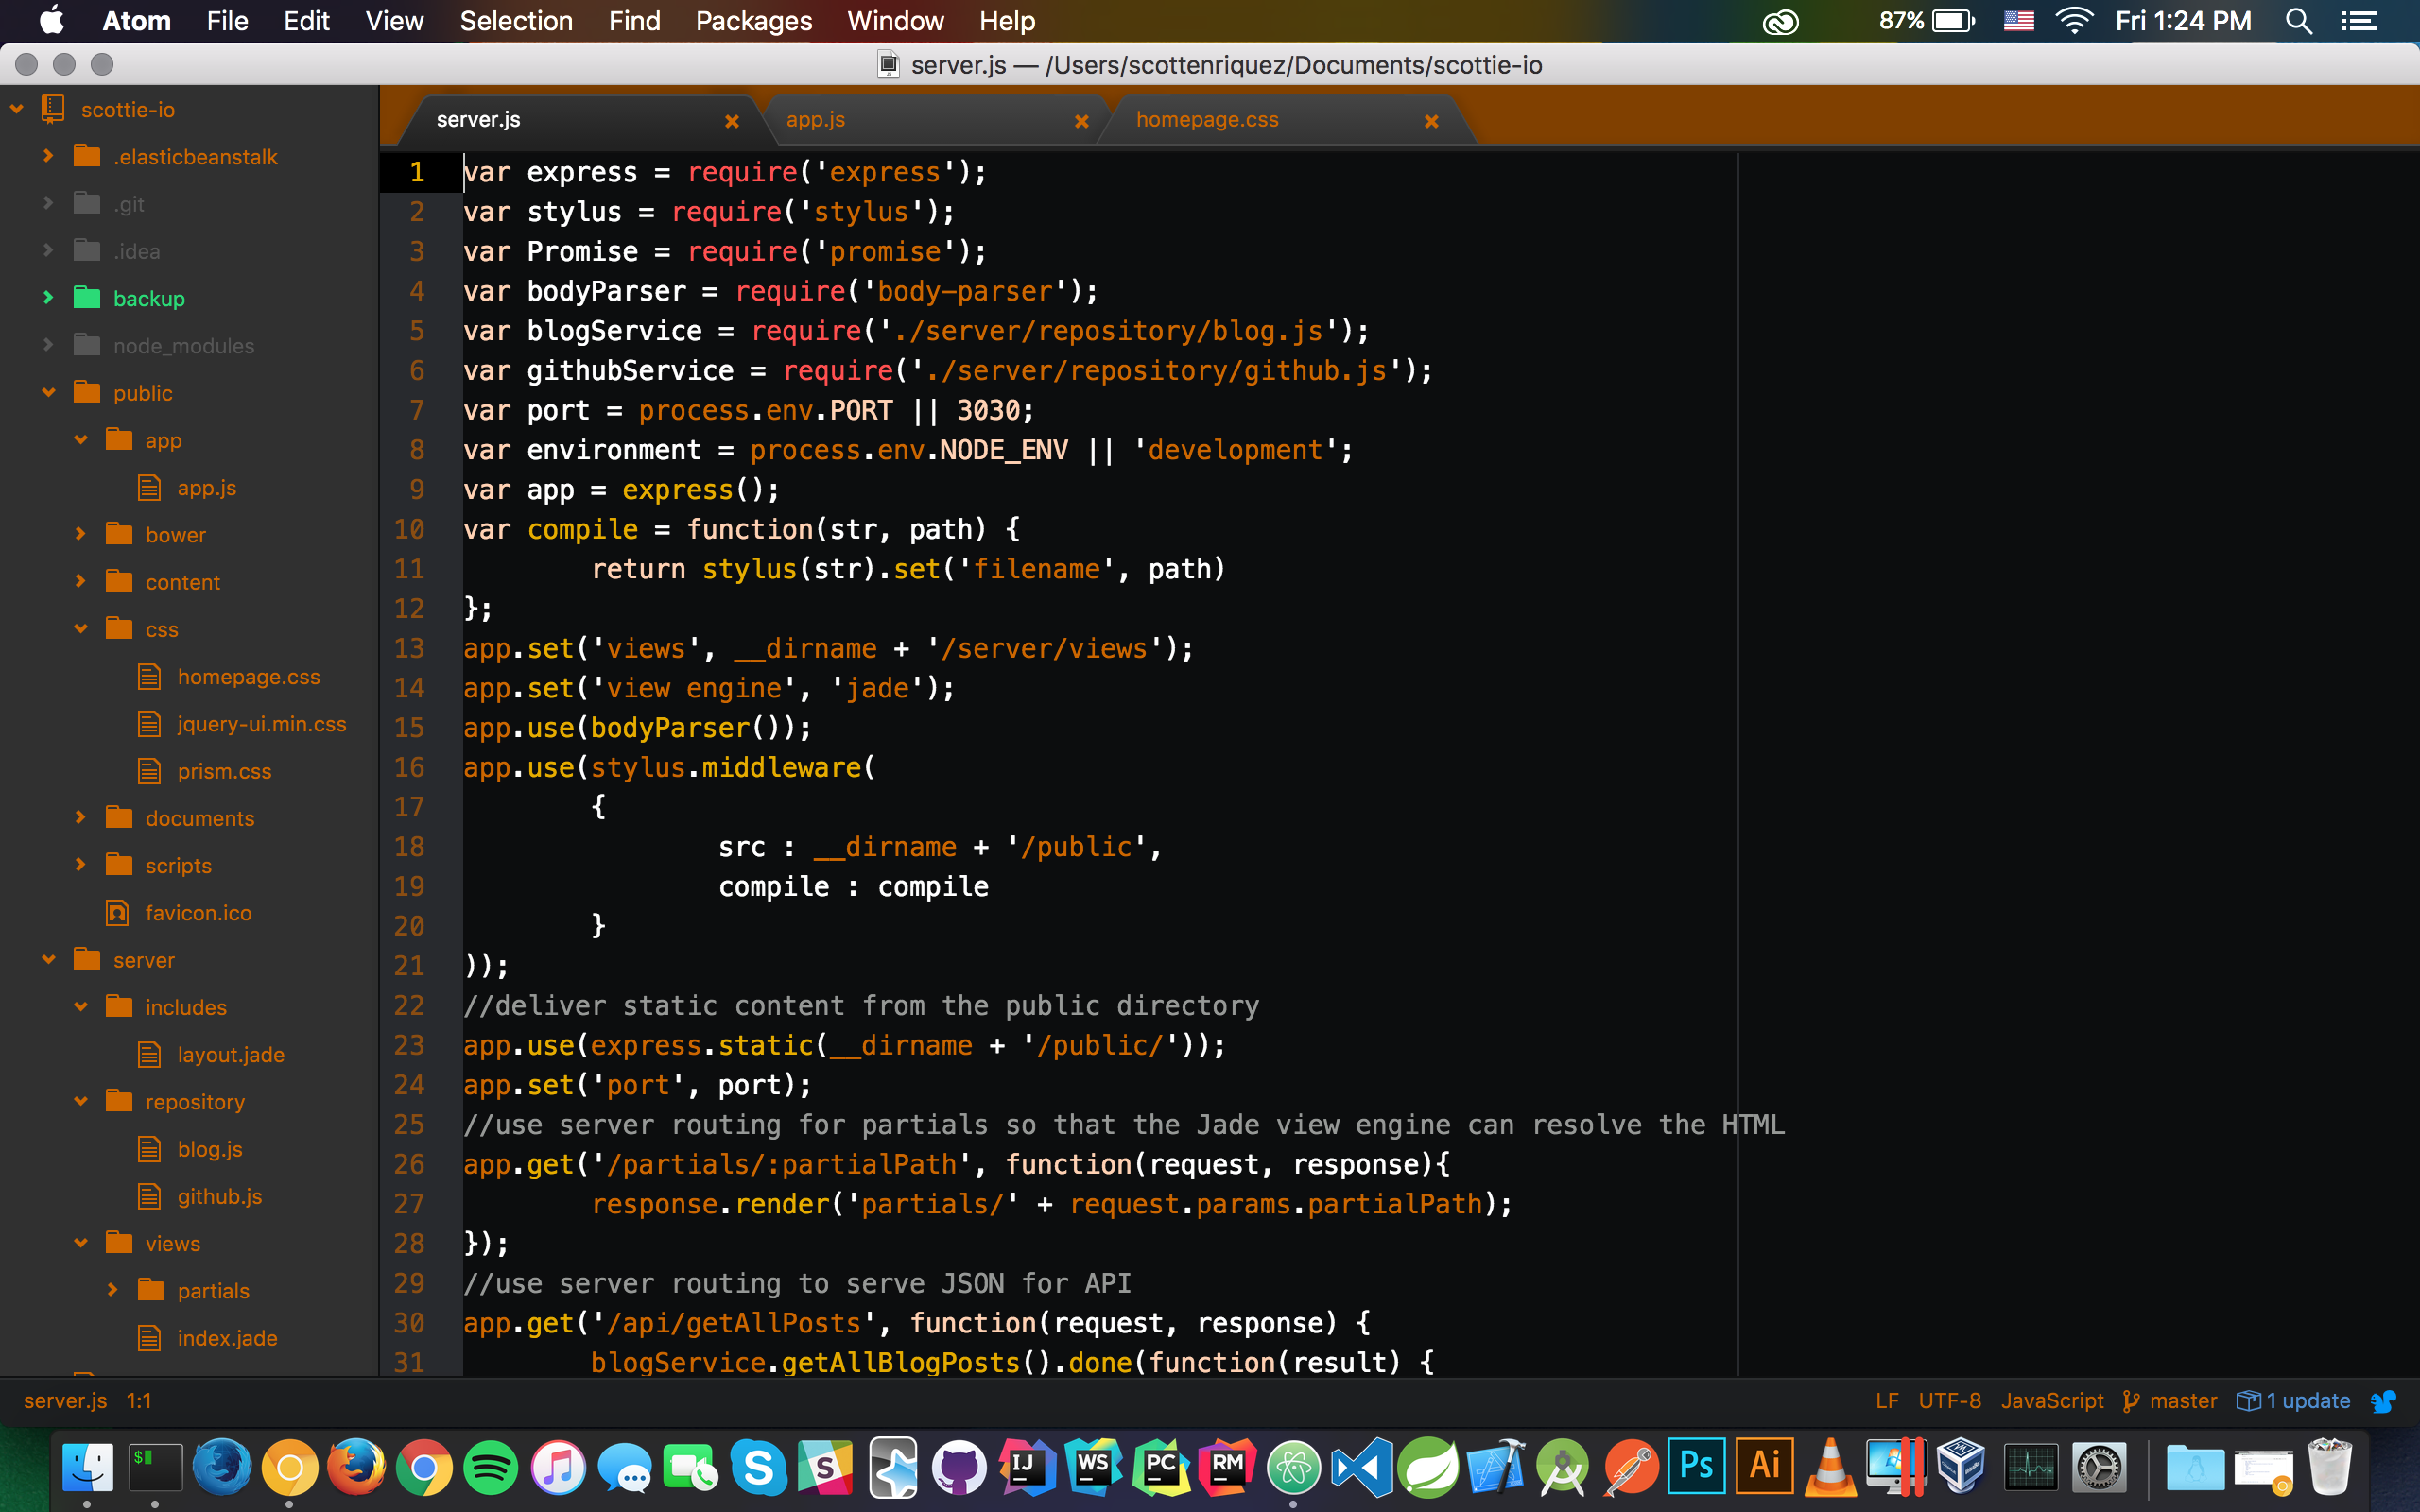
It's safe to say that I'm biased because of my alma mater, but I personally think that burnt orange is one of the most versatile colors. It's somewhat polarizing due to being the primary color of the University of Texas, but I use it as one of the core colors here on my personal website to show my Longhorn pride. Inspired by this color palette, I've created a theme for Atom, my favorite text editor, and released version 1.0.0 just in time for the start of college football season.

Atom editor in burnt orange

To use this theme, ensure that you have the Atom text editor installed. Themes in Atom are split into UI themes and syntax themes. Syntax themes change the style for the text editing area itself, and UI themes change the style everything else. I have created both, and they can be installed either through the application menus or via the command line using apm install atom-burnt-orange-ui and apm install atom-burnt-orange-syntax. For more information and the source code, check out the Atom documentation pages for atom-burnt-orange-ui and atom-burnt-orange-syntax.

I'm by no means a UI/UX expert, so feel free to submit a pull request for any improvements. I intend on maintaining the code for future Atom releases.

ISP Complainer

· 5 min read
Scottie Enriquez
Senior Solutions Developer at Amazon Web Services

Motivation

I have long battled my internet service providers, and they have waged war on their customers for many years as well. Poor customer service, data caps with obscene overage charges, and many other issues have plagued me for years like many other Americans. Like many of these people, I’m stuck with only one viable option for a provider due to their monopolistic practices. Recently, I was forced to upgrade to a more expensive monthly plan after going over my data cap three times non-consecutively over a year and a half period. Rather than charging me the usual absurd per-gigabyte overage charge, I’m now stuck paying more per month for the remainder of my time with my ISP.

"You’ll also get an increase in speed as well," the representative told me. Well, I’ve decided to hold my ISP accountable. Since my ISP was so diligent in tracking my overages, I’m going to be diligent in tracking the speeds that I’m getting. Inspired by a post on Reddit, I built an application to let my ISP know whenever I’m not getting my promised speeds, and I’m running it off of my Raspberry Pi. Here’s how you can use it too.

Raspberry Pi Setup

Note that you do not need to run ISP Complainer on a Raspberry Pi. I built this application using Node.js, which can run on any operating system. I treat my Raspberry Pi like a little UNIX server and leave it running all the time. If you do not plan on running this on a Pi, you can skip to the next section.

Raspberry Pi uses ARM while most modern desktop processors use the x86 instruction set architecture. Because of this, you’ll need Node.js binaries compiled for ARM. In the early days, these files weren’t maintained like they are for x86 and compiling from the source code was required. This is still a viable option if you want to target a specific version, but you can also just use a download maintained by node-arm using the following commands:

wget http://node-arm.herokuapp.com/node_latest_armhf.deb
sudo dpkg -i node_latest_armhf.deb

Update: the ARM binaries are now available on the Node.js downloads page.

Local Setup

Once Node.js and NPM are installed, fetch the code for ISP Complainer using the command git clone git@github.com:scottenriquez/isp-complainer.git. You can also access the repository via the web interface. Once the repository had been cloned, navigate to the /isp-complainer root folder and install all dependencies using the npm install command. Then, start the web server with the command node server.js or nodemon server.js.

Configuration

Start by creating a Twitter API key. This will allow you to programmatically create tweets to your ISP. You can either create a new Twitter account like I did with @ISPComplainer or use your existing account. Note that in either case, you should treat your API key just like a username and password combination, because if exposed the person who intercepts it can take actions on your behalf. To create an API key, login to the Twitter application management tool and create a new app. Follow all of the steps and take note of the four keys that you’re provided with.

Once you have your keys, you’ll need to add them to a file called /server/configs/twitter-api-config.js. This file is excluded by the .gitignore so that the API key is not exposed upon a commit. Copy the template to a new file using the command cp twitter-api-config-template.js twitter-api-config.js, and then enter the keys inside of the quotes of the return statement for each corresponding function. If you would prefer to store these inside of a database, you can inject the data access logic here as well. See the config template below:

twitter-api-config-template.js
module.exports = {
twitterConsumerKey: function () {
return ""
},
twitterConsumerSecret: function () {
return ""
},
twitterAccessTokenKey: function () {
return ""
},
twitterAccessTokenSecret: function () {
return ""
},
}

One other config must be modified before use:

complaint-config.js
module.exports = {
tweetBody: function (promisedSpeed, actualSpeed, ispHandle) {
return (
ispHandle +
" I pay for " +
promisedSpeed +
"mbps down, but am getting " +
actualSpeed +
"mbps."
)
},
ispHandle: function () {
return "@cableONE"
},
promisedSpeed: function () {
return 150.0
},
threshold: function () {
return 80.0
},
}

tweetBody() generates what will be tweeted to your ISP. Note that the body must be 140 characters or less including the speeds and ISP’s Twitter handle. ispHandle() returns the ISP’s Twitter account name. A simple search should yield your ISP’s Twitter information. Be sure to include the '@' at the beginning of the handle. promisedSpeed() returns the speed that was advertised to you. threshold() is the percent of your promised speed that you are holding your ISP to. If the actual speed is less than your promised speed times the threshold, a tweet will be sent.

Optionally if you want to manually change the port number or environment variable, you can do so in the server file:

server.js
...
var port = process.env.PORT || 3030;
var environment = process.env.NODE_ENV || 'development';
...

Using the ISP Complainer Dashboard

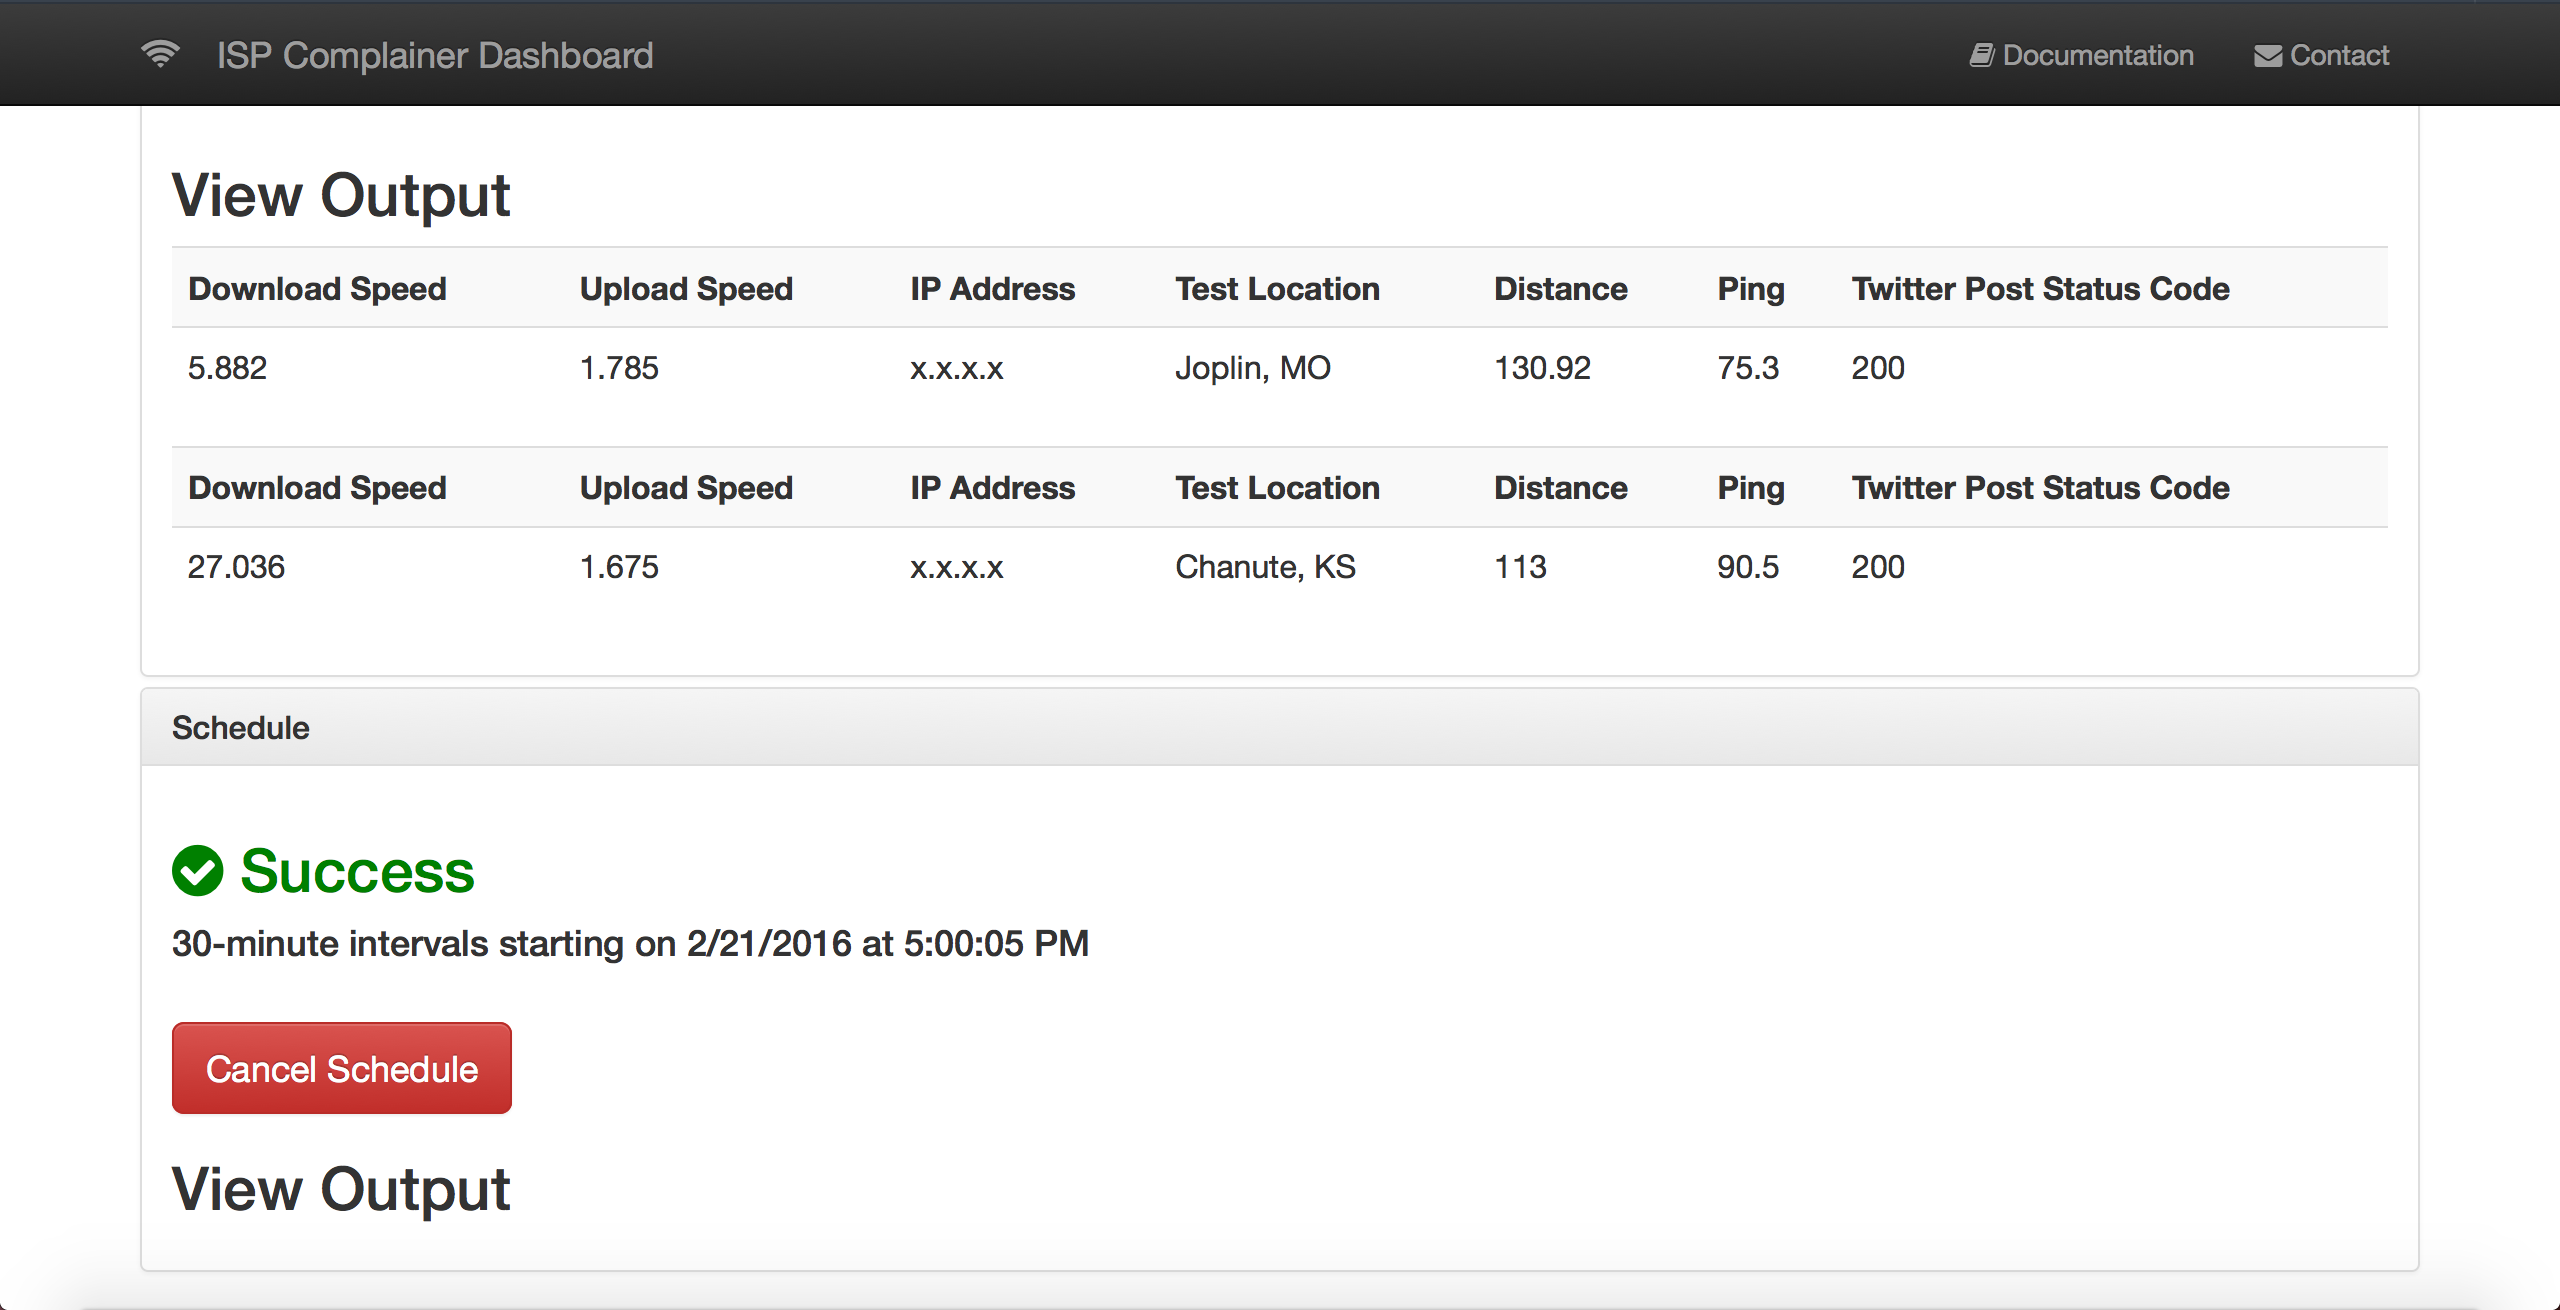
ISP Complainer

After starting the server, you can access the dashboard via http://localhost:3030/. This interface allows two options: manual and scheduled checks. The manual option allows you to kick off individual requests at your will, and the schedule allows you to run the process over custom intervals. All of the scheduling is handled with Angular’s $interval, and the results are tracked in the browser. Note that if you close the browser, no more checks will be scheduled and you will lose all of the results currently displayed on the browser.

For any issues or enhancements, feel free to log them in the issue tracker.

Getting Started with Python and Flask on AWS

· 6 min read
Scottie Enriquez
Senior Solutions Developer at Amazon Web Services

Getting Started: Convention Over Configuration

This software development paradigm has become prevalent in many modern frameworks and tools. It can be described as streamlining and standardizing aspects of development similar to all or most projects while specifying configurations for those that deviate from the established convention. For example, most Node.js developers call their main file server.js. Let’s say that I want to write a generic deployment script for Node.js applications. It’s much easier to include a simple command like node server.js than to try to determine the developer’s intended start file. This simple agreement saves a great deal of time and configuration details. The emphasis of this paradigm is that the knowledge will hold for any team or company, and so organizations full of old tribal knowledge become a thing of the past.

Personally, I’m a huge proponent of convention over configuration. Amazon Web Services use this paradigm as well as part of their Platform as a Service offerings, but unfortunately the documentation is sparse, which is the main downfall of convention over configuration. Simply put, if no one knows about your convention or which conventions you’re opting to use, it’s ultimately useless. Soapbox aside, I’m going to cover how I got my initial Python environment setup and some conventions necessary for successful deployment.

Setting Up a Python Environment Using Elastic Beanstalk

I initially tried to use this guide from Amazon to deploy a simple RESTful service built with Flask. I’m not an infrastructure person at all, so I struggled through the steps. I failed to produce anything meaningful, so I decided to switch up my approach. One odd thing about this documentation, other than the fact that it was created in 2010, is that this seems to be the Infrastructure as a Service approach. The instructions have you provisioning an EC2 instance and creating your own virtual environment, then manually starting and stopping Elastic Beanstalk. As a developer, I like being abstracted from all of that whenever possible, so I decided to use the Platform as a Service approach instead.

The first step is to create your application using Elastic Beanstalk via the AWS Management Console. When you create your new application, AWS will automatically create an EC2 instance for your application to reside on. During this initial setup, you can specify what predefined configuration you want to use such as Python, Node.js, and PHP. For the sake of this demo, choose Python. Once you choose the rest of your options, most of which are overkill for this simple demo, AWS will create your application within a few minutes.

Configuring Your Local Machine

While your application and EC2 instance are being provisioned, start preparing your local machine. First of all, install the Elastic Beanstalk command line tools via pip or Homebrew if using Mac. Secondly, create an IAM user and store your credentials locally so that they are not present in source code. Note that you can manage the roles and permissions for all users in the Identity and Access Management section of the AWS console. For the sake of this demo, be sure to grant the user the full S3 and Elastic Beanstalk access policies.

Testing the Code Locally

I have created a Python 2.7 demo for this post on hosted the code in this GitHub repository. You can clone the code using the following command in the desired directory: git clone git@github.com:scottenriquez/scottie-io-python-aws-demo.git. I've also included the source code below for convenience.

application.py
from flask import Flask, request, url_for, jsonify
from boto.s3.key import Key
import boto
import boto.s3.connection
import uuid

application = Flask(__name__)

@application.route("/data/", methods = ["POST"])
def data():
try:
data = request.form["data"]
connection = boto.connect_s3()
#update with your S3 bucket name here
bucket_name = "test"
bucket = connection.get_bucket(bucket_name, validate = False)
key = Key(bucket)
guid = uuid.uuid4()
key.key = guid
key.set_contents_from_string(data)
key.make_public()
return jsonify({"status" : "success"}), 201
except Exception as exception:
return jsonify({"status" : "error", "message" : str(exception)}), 500

if __name__ == "__main__":
application.run()
requirements.txt
flask==0.10.1
uuid==1.30
boto==2.38.0

After obtaining the code, make sure the proper dependencies are installed on your machine. This demo requires three pip packages: Flask, UUID, and Boto. Be sure to create an S3 bucket and update the code to target your desired bucket. Once all of this is configured, you can run the code using the command python application.py.

This code creates a simple RESTful service that takes raw data and stores it as an S3 file with a universally unique identifier for the name. To test the code, use a REST client like Postman to perform an HTTP POST on http://localhost:5000/data/ with the parameter called data containing the data to be posted to S3. The service will return a JSON message with either a status of "success" or an exception message if something went wrong.

Deploying to Elastic Beanstalk

It’s important to note that the names of the two files cannot be changed. As mentioned in the first paragraph, AWS uses convention over configuration. When deploying, Elastic Beanstalk searches for a file called application.py to run. The other file is used to manage dependencies. If you didn’t have the three required pip packages on your local machine, you simply fetched them. Due to autoscaling and other factors, you can’t guarantee that the server that your code is deployed to contains the packages that your code depend on prior to deployment. Because of this, rather than using SSH to connect to an EC2 instance and executing several pip install commands for every new instance, it's best to list of all dependent packages and versions inside of a file called requirements.txt. This way whenever the code is deployed to a new EC2 instance, the build process knows which packages to fetch and install.

Once the code is working locally, we’re ready to deploy to AWS. Start by running the eb init command in the code’s directory. Be sure to choose the same region that was specified when the Elastic Beanstalk application was created. You can verify that the environment was created properly by running the command eb list or simply run eb for a list of all available commands. After initialization, execute eb deploy. The status of the deployment can be monitored via the command line or the AWS console. Once the deployment is completed, testing can be done via the same REST client, but substitute the localhost URL for the Elastic Beanstalk specified one.

You now have a working Python REST service on AWS!